The Ontario Ministry of the Environment, Conservation and Parks (MECP) operates a network of three fixed air monitoring stations within the City of Hamilton which serve as Provincial Air Quality Health Index (AQHI) monitoring stations. To see the locations of air monitoring stations click here
Air quality has improved significantly across the province over the last 20 years, with large decreases in harmful pollutants such as nitrogen dioxide, carbon monoxide, fine particulate matter, and sulphur dioxide. The table below shows air pollutant’s total and annual percent reduction as measured at the Ministry of the Environment, Conservation and Parks, Hamilton Downtown Station (Station 29000):
Clean Air Hamilton – Pollutant % Reduction From Regression Trends 2017
| · Total suspended particulate (TSP) – 57% total reduction over 20 years
· Inhalable particulate matter (PM10) – 37% total reduction over 20 years · Respirable particulate matter (PM2.5) – 26% total reduction over 18 years · Nitrogen dioxide (NO2) – 54% total reduction over 20 years · Sulphur dioxide (SO2) – 46% total reduction over 20 years · Total reduced sulphur odours – 98% total reduction over 20 years* · Benzene – 89% total reduction over 20 years** · Polycyclic aromatic hydrocarbons (PAH) measured as benzo[a]pyrene – 78% total reduction over 20 years.** |
| *Expressed as number of hours above 10 ppb threshold
**Benzene and PAH not available from Station 29000 for 2017 yet |
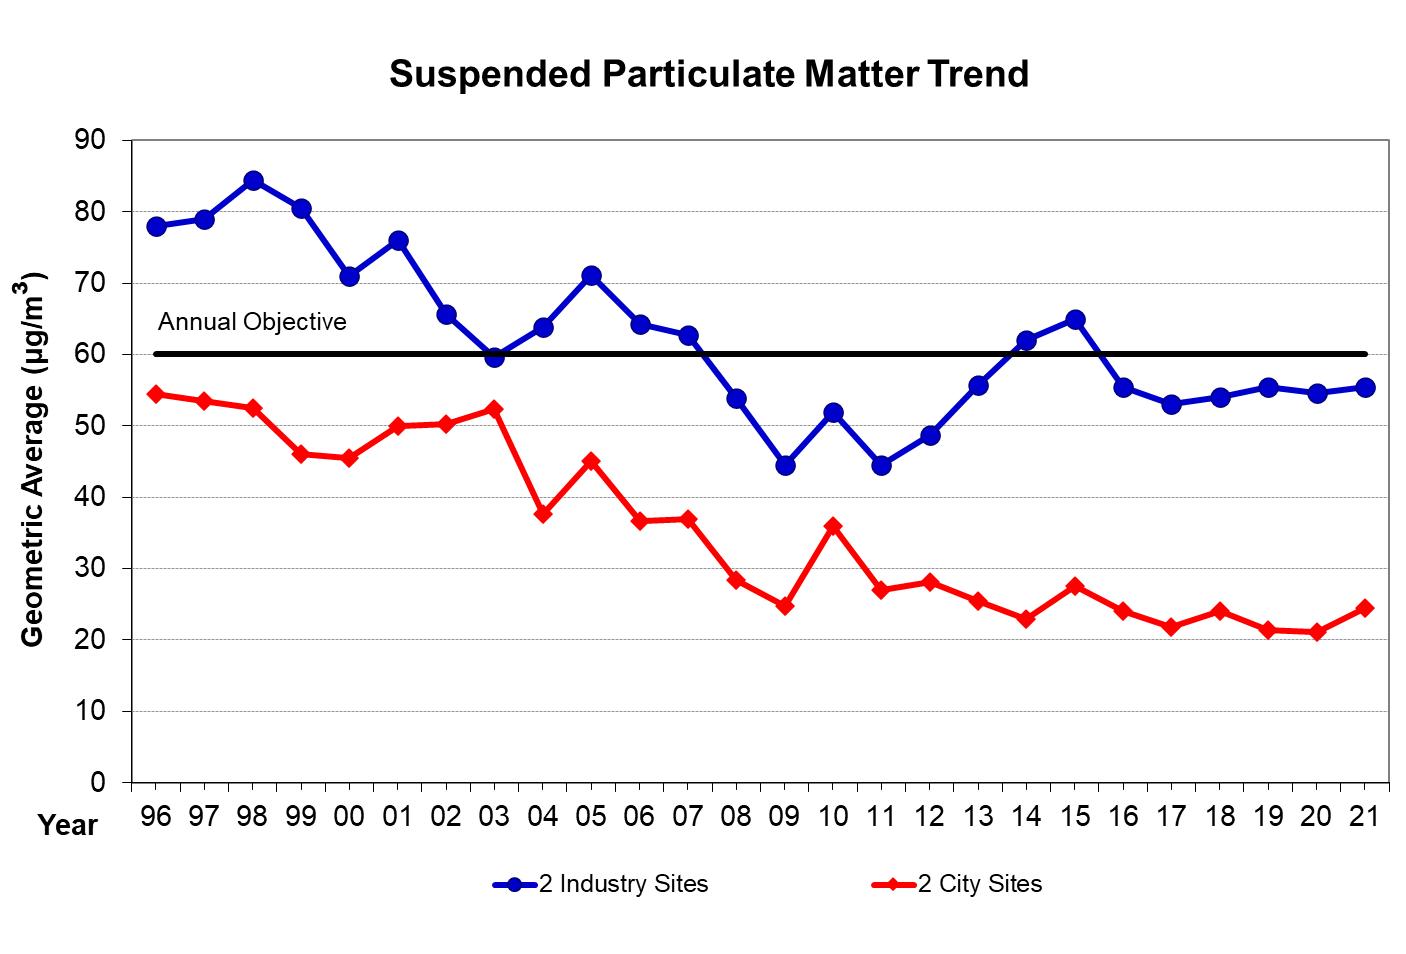
Total Suspended Particulate
Total suspended particulate (TSP) includes all particulate material with diameters less than about 45 micrometers (µm). A substantial portion of TSP is composed of road dust, soil particles and emissions from industrial activities and transportation sources.
There has been a steady decline in TSP at City sites while levels have risen in previous years at industry sites. There was a decline in 2017 lowering emissions at industry sites below the annual objective.
Included in the TSP category are inhalable particulates (PM10) and respirable particulates (PM2.5). It is possible to determine the net amount of particulate material in the air with sizes between about 45 µm and 10 µm, by subtracting PM10 from the TSP value.
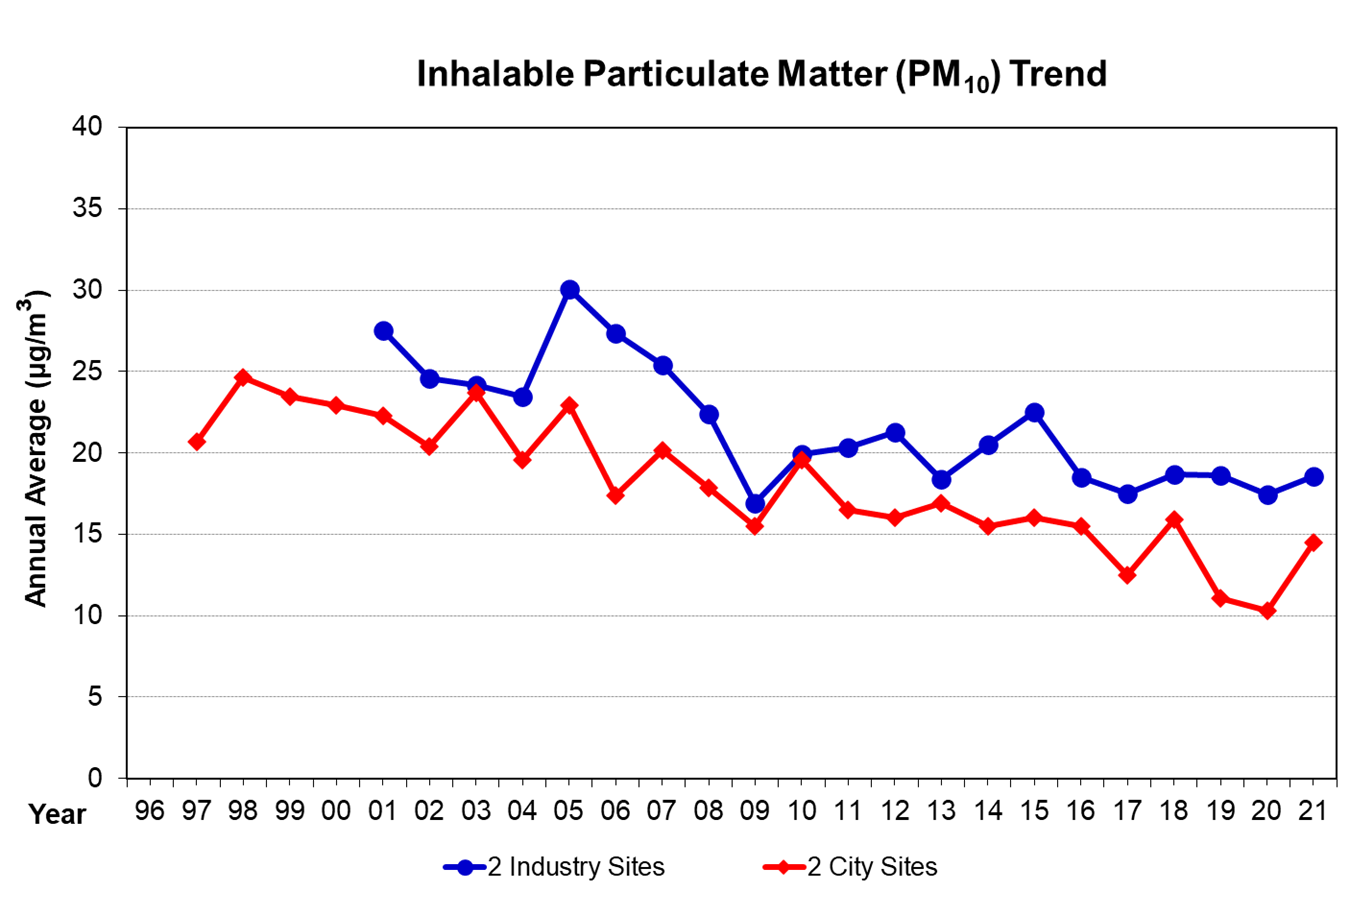
Inhalable Particulate Matter (PM10)
Inhalable particulate matter (PM10) has a diameter of 10 µm or less. PM10 makes up 40-50% of TSP in Hamilton and has been linked to respiratory, cardiovascular and other health impacts in humans.1
PM10 is primarily derived from vehicle exhaust emissions, industrial fugitive dusts, and the finer fraction of re-entrained road dust.
PM10 at City sites has decreased by about 21% over the past decade. This is likely a combination of better performance of vehicle fleets, better management of dust track-out by industries, and the use of better street sweepers and street sweeping practices by the City.
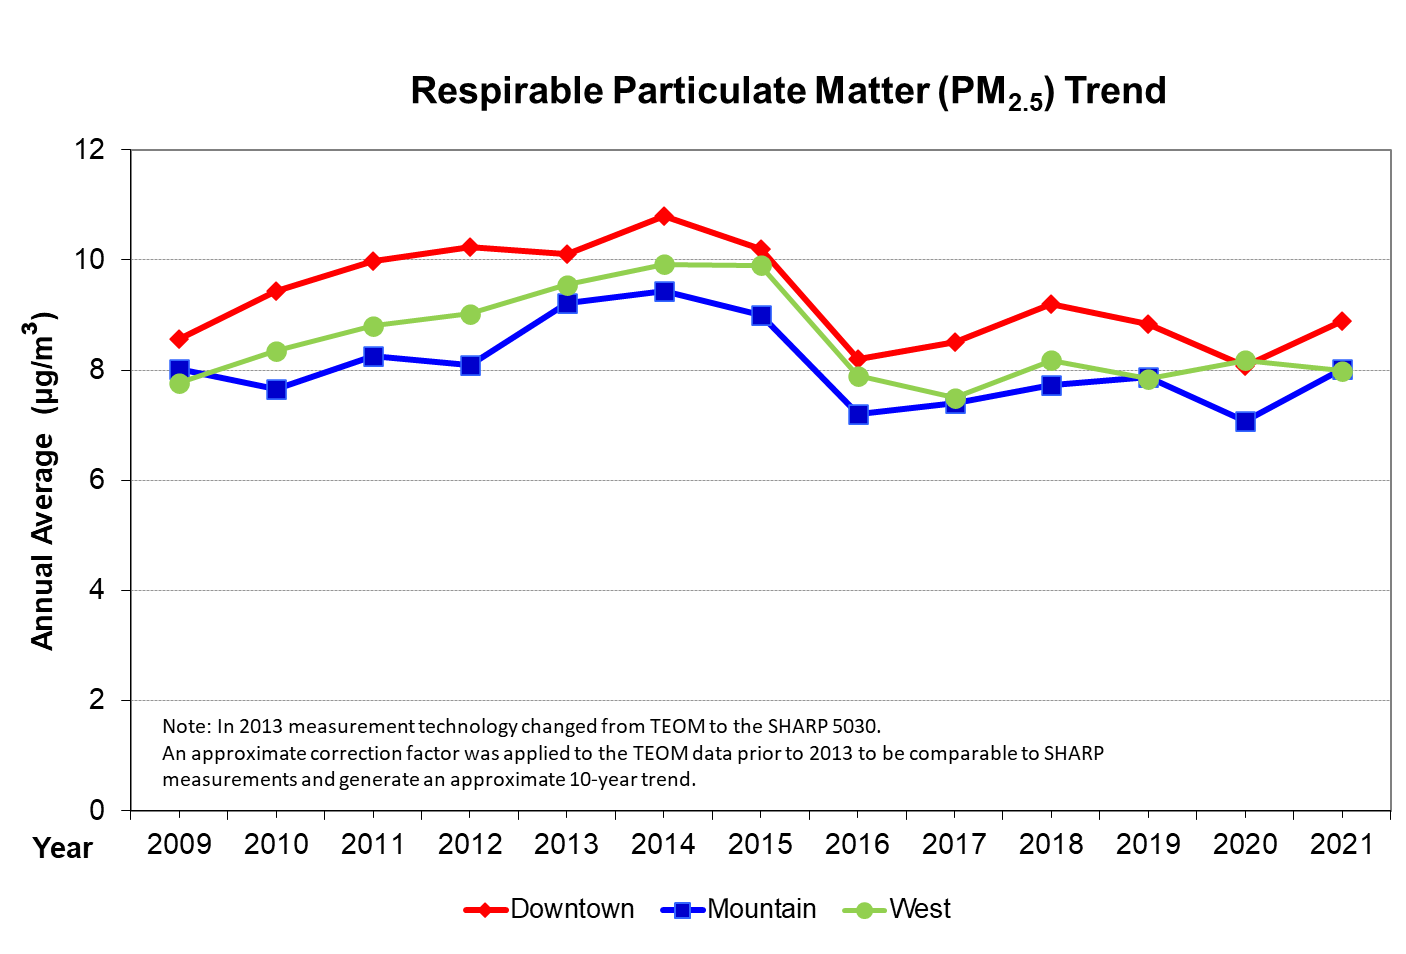
Respirable Particulate Matter (PM2.5)
The Ontario government started measuring PM2.5 across Ontario in 1999. PM2.5 makes up about 60% of PM10 and is mostly derived in cities from vehicle emissions.
Scientists now agree that exposure to the small particles and the organic substances is the likely cause of the observed respiratory and cardiovascular health impacts attributed to particulate material exposure.1
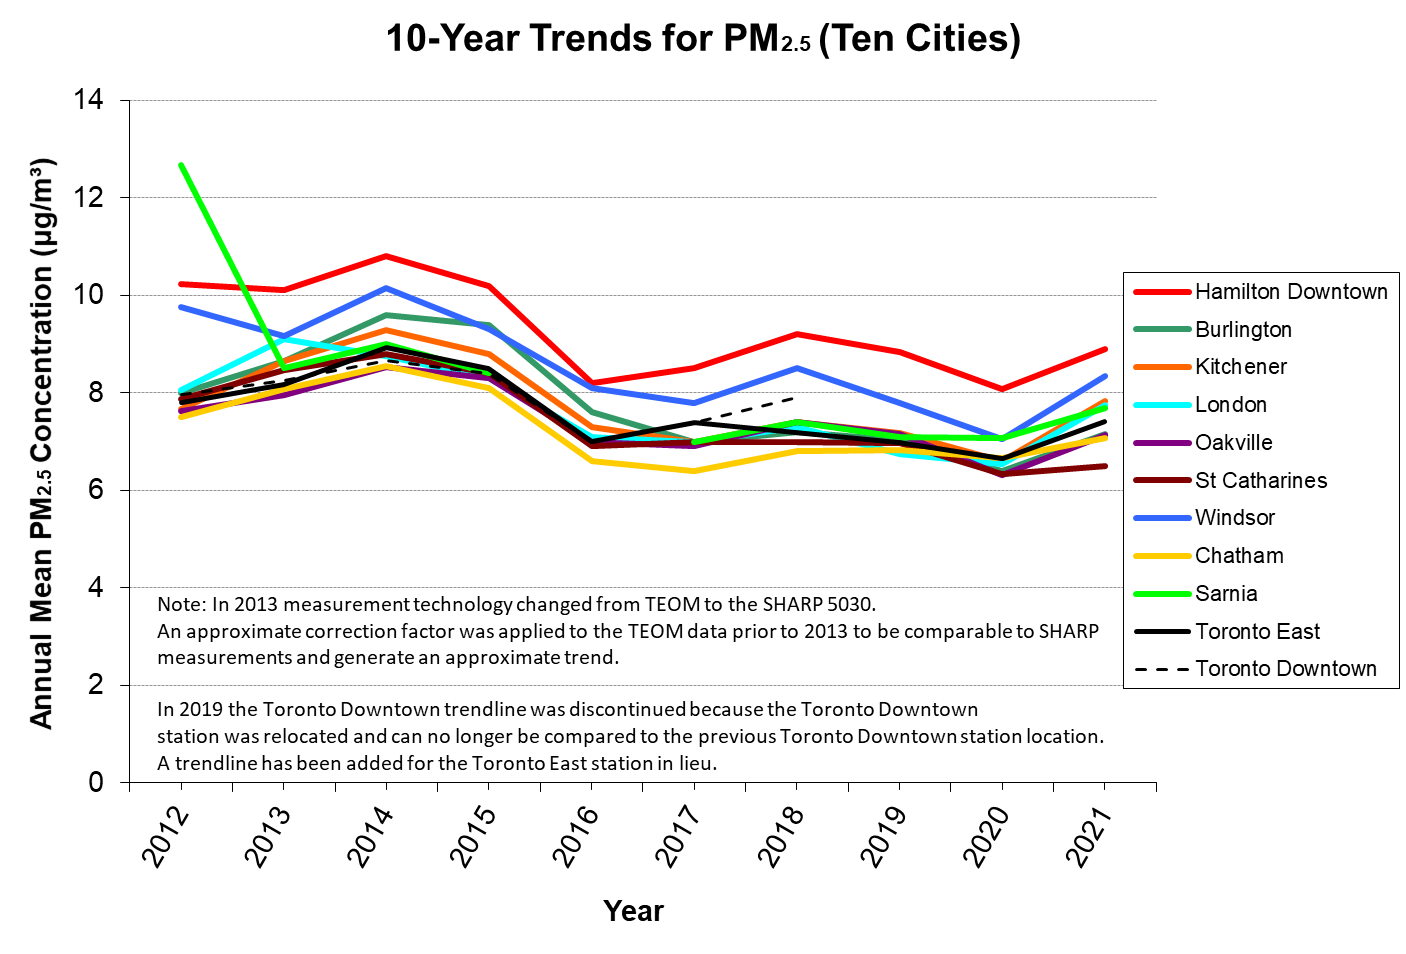
The trend in PM2.5 showed a 3.5% decrease per year since 1999 until 2009 at the downtown and mountain AQHI sites. The apparent increase in 2013 is not reflective of a change in air quality but is a result of change in monitoring to a more sophisticated and sensitive PM2.5 monitoring technology. There has been a decline in PM2.5 concentrations across Hamilton and is now below the Canadian Ambient Air Quality Standards (CAAQS). CAAQS are becoming more stringent in 2020 and therefore more work will be needed to meet the future standards.
The graph below shows a comparison of twelve-year trends in respirable particulate matter (PM2.5) levels in four Ontario cities. The trends in PM2.5 in Hamilton is mirrored at other locations across southern Ontario.
Ground Level Ozone
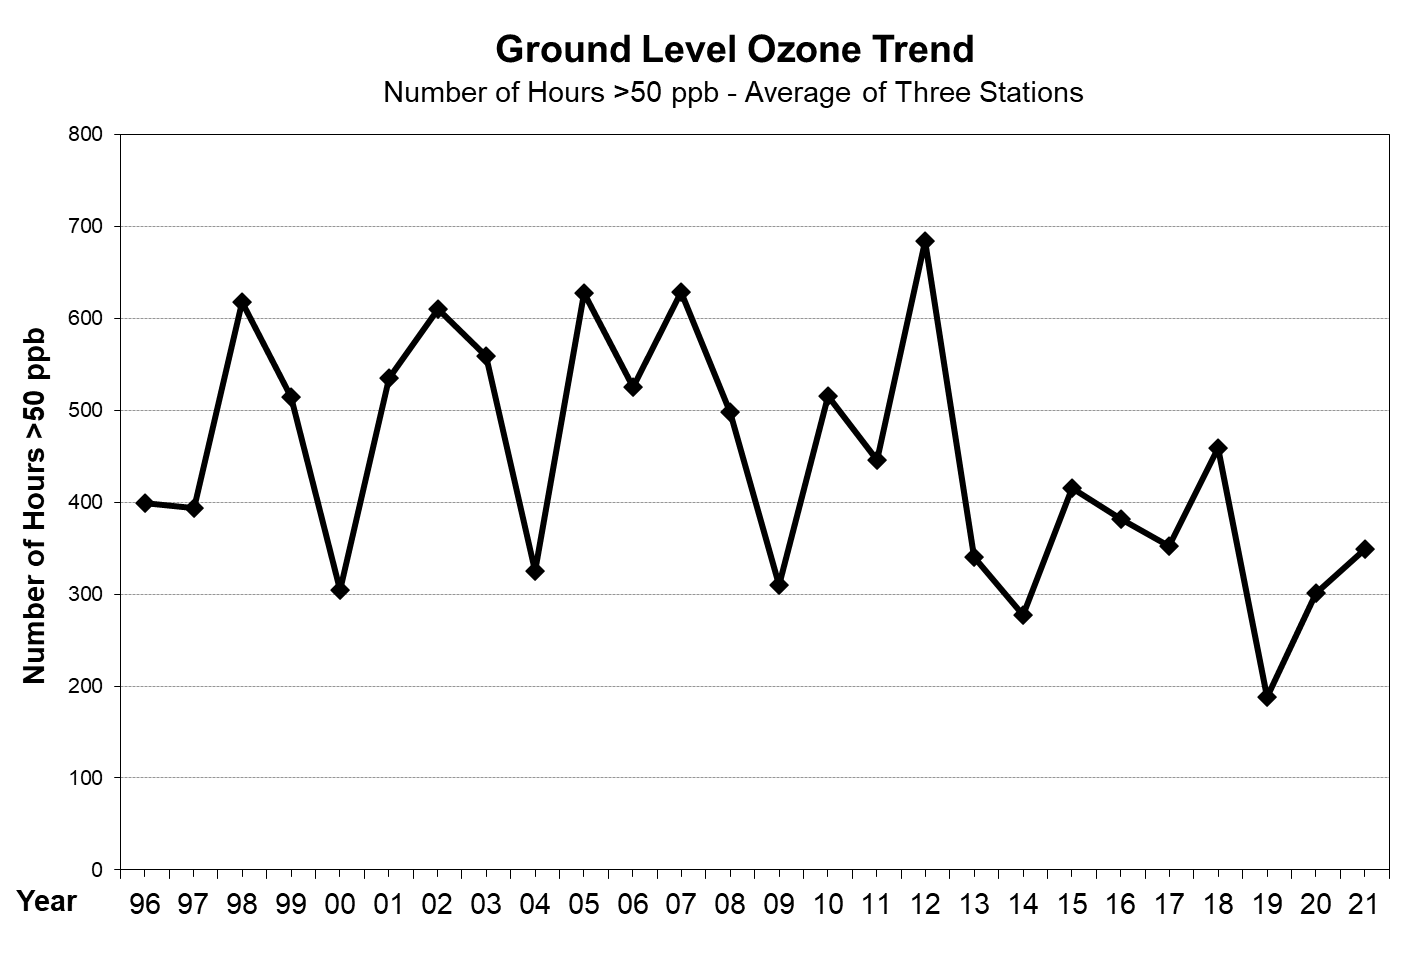
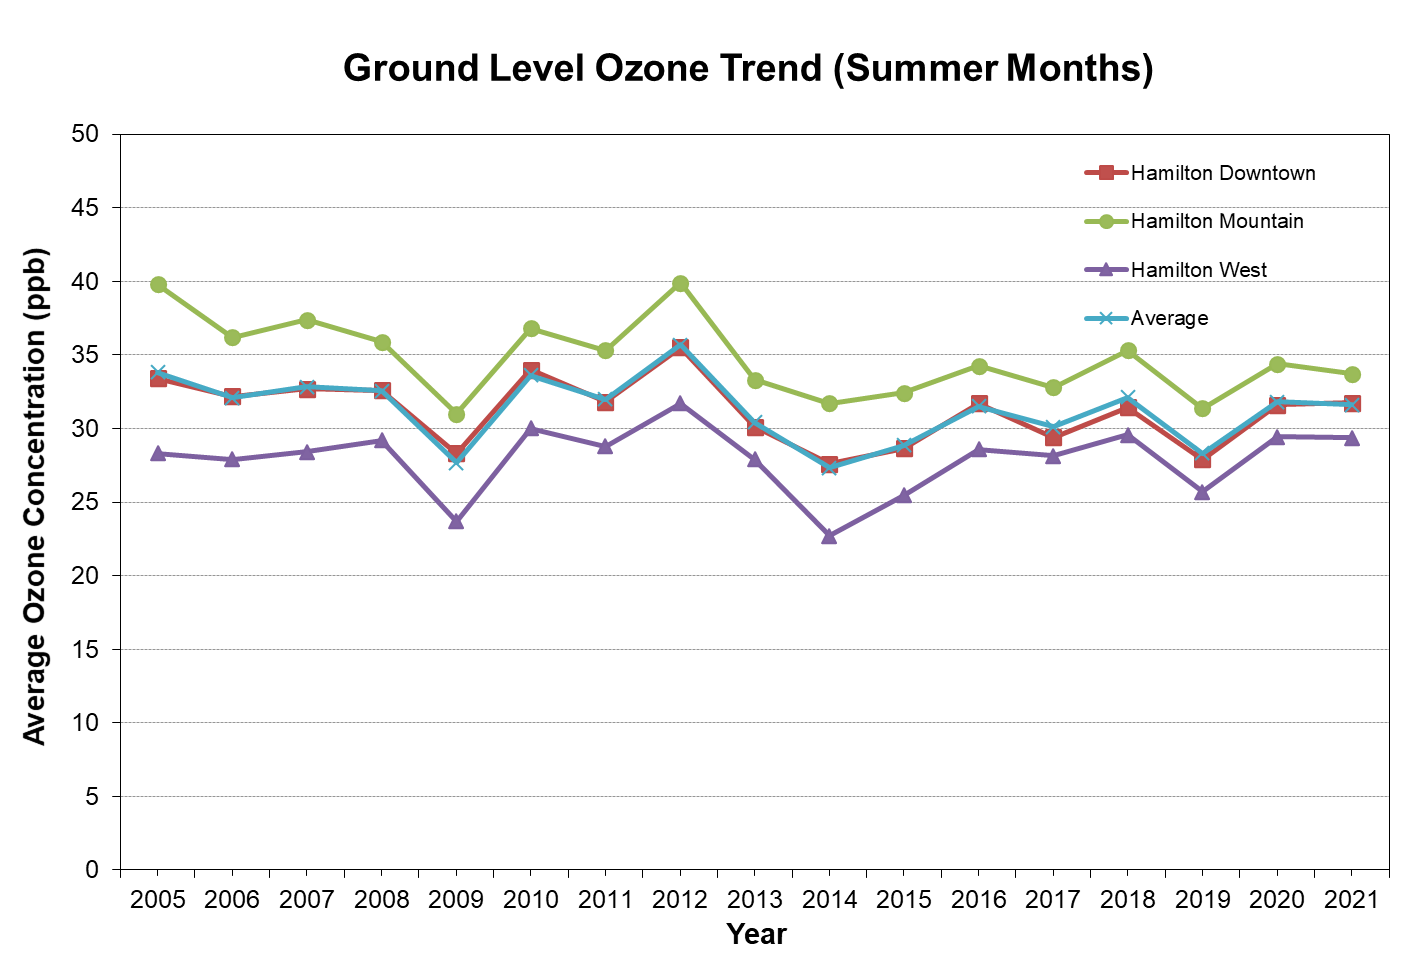
Ground level ozone (O3 or tropospheric ozone) is formed when pollutants are emitted and react with the presence of sunlight. This is why O3 concentrations are higher during summer months. Sources include: coal-fired power plants, vehicles and urban activities.
The trend in O3 shows that concentrations have been highly variable in the past 10 years with the trend line flat. O3 was a main contributor for Hamilton`s smog days and unlike other pollutants the majority of O3 comes from sources upwind of Hamilton and are expected to originate in the Midwest Ohio Valley region. Sources from Hamilton contributing to O3 pollution will affect areas downwind of Hamilton which makes lowering O3 emissions very important.
The Government of Ontario has been dedicated to lowering O3 precursor emissions by eliminating all coal-fired power plants in Ontario.
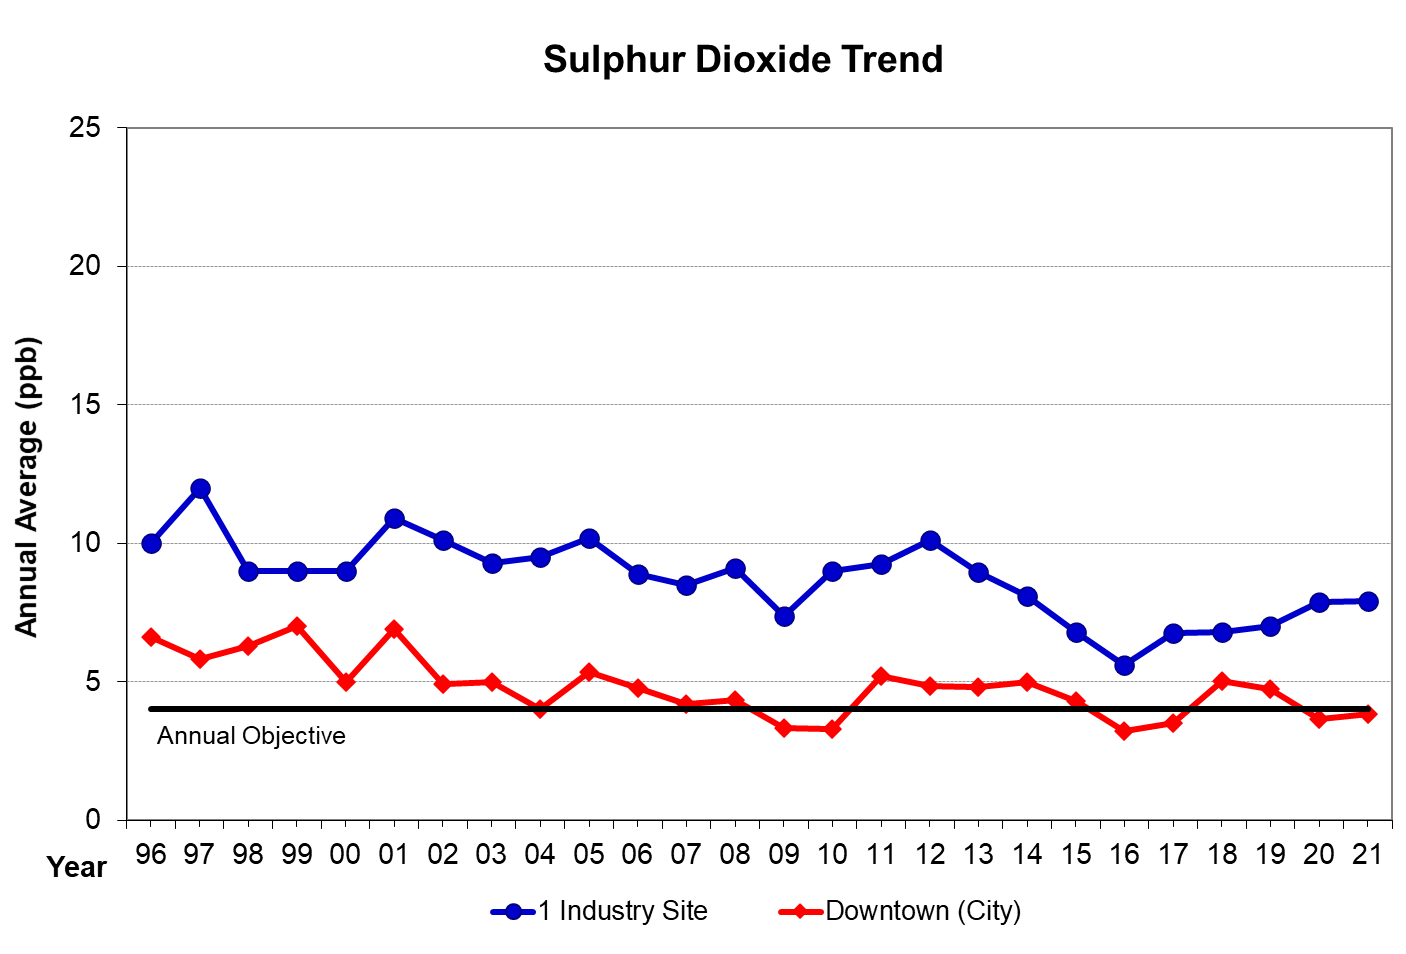
Sulphur Dioxide
Sulphur Dioxide is the product of industrial activity with over 90% generated within the City. SO2 is not only a respiratory irritant but is converted in the atmosphere over several hours to sulphuric acid (H2SO4), which is then converted to sulphate particles. These particles tend to be acidic in nature and cause lung irritation.
Significant reductions in air levels of SO2 were made in the 1970s and 1980s. Since 1998, there has been a gradual and continuous decline in air levels of SO2 besides the recent increase in 2016 and 2017.
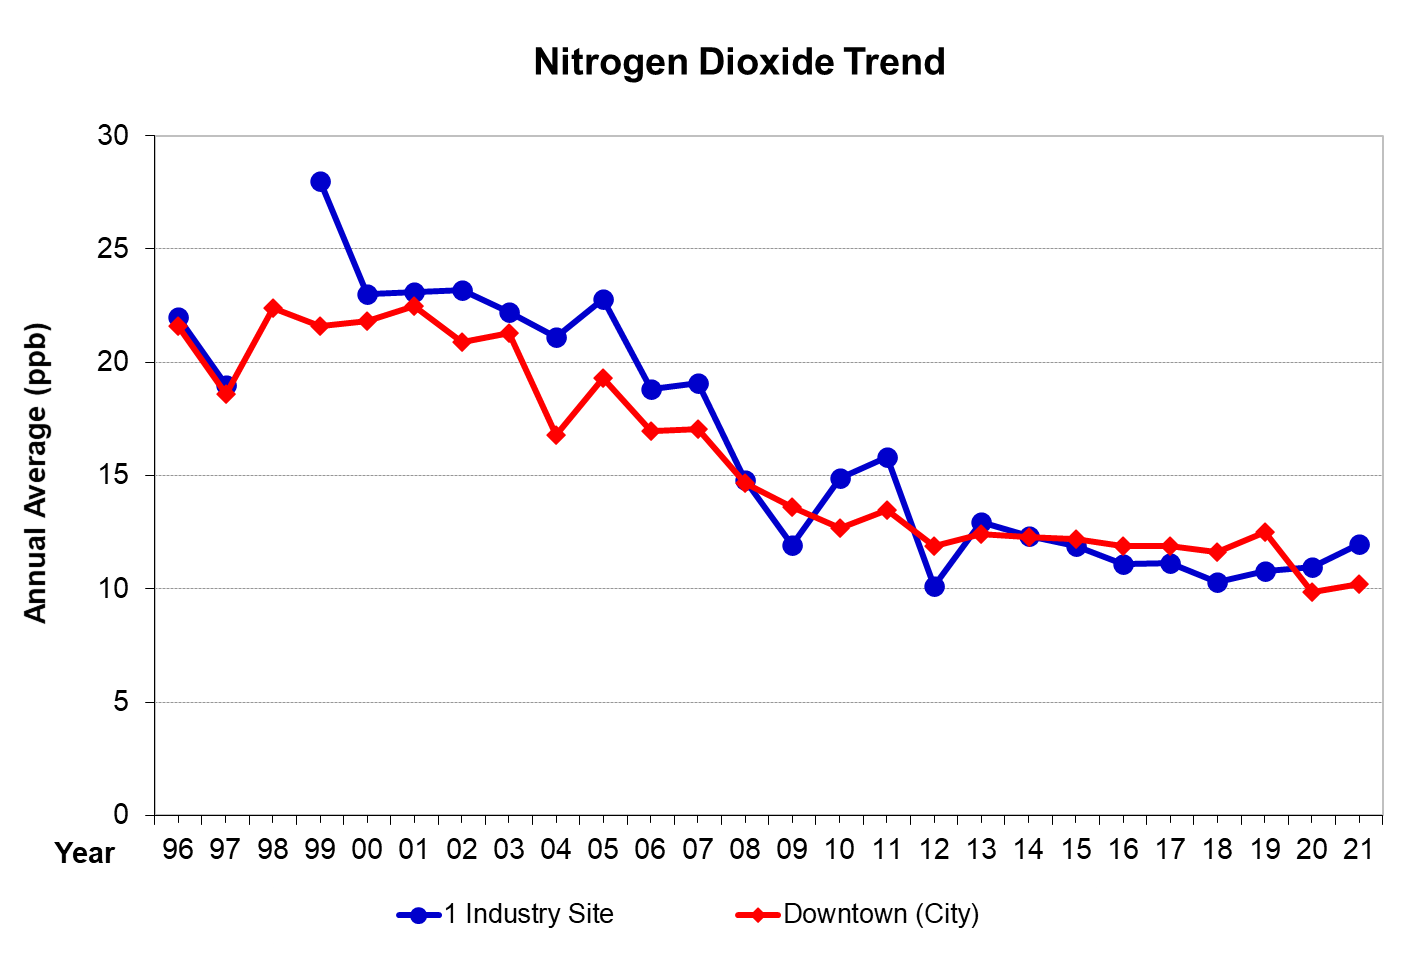
Nitrogen Dioxide
Nitrogen Dioxide (NO2) is formed in the atmosphere from nitric oxide (NO) which is produced during combustion of fuels (i.e gasoline, diesel, coal, wood, oil and natural gas) and is responsible for a significant share of the air pollution-related health impacts in Hamilton. The leading sectors producing these emissions are the transportation and industrial sectors. The level of vehicle use across Hamilton has increased slightly during the past decade, however overall NO levels have decreased most likely due to improved engine technologies.
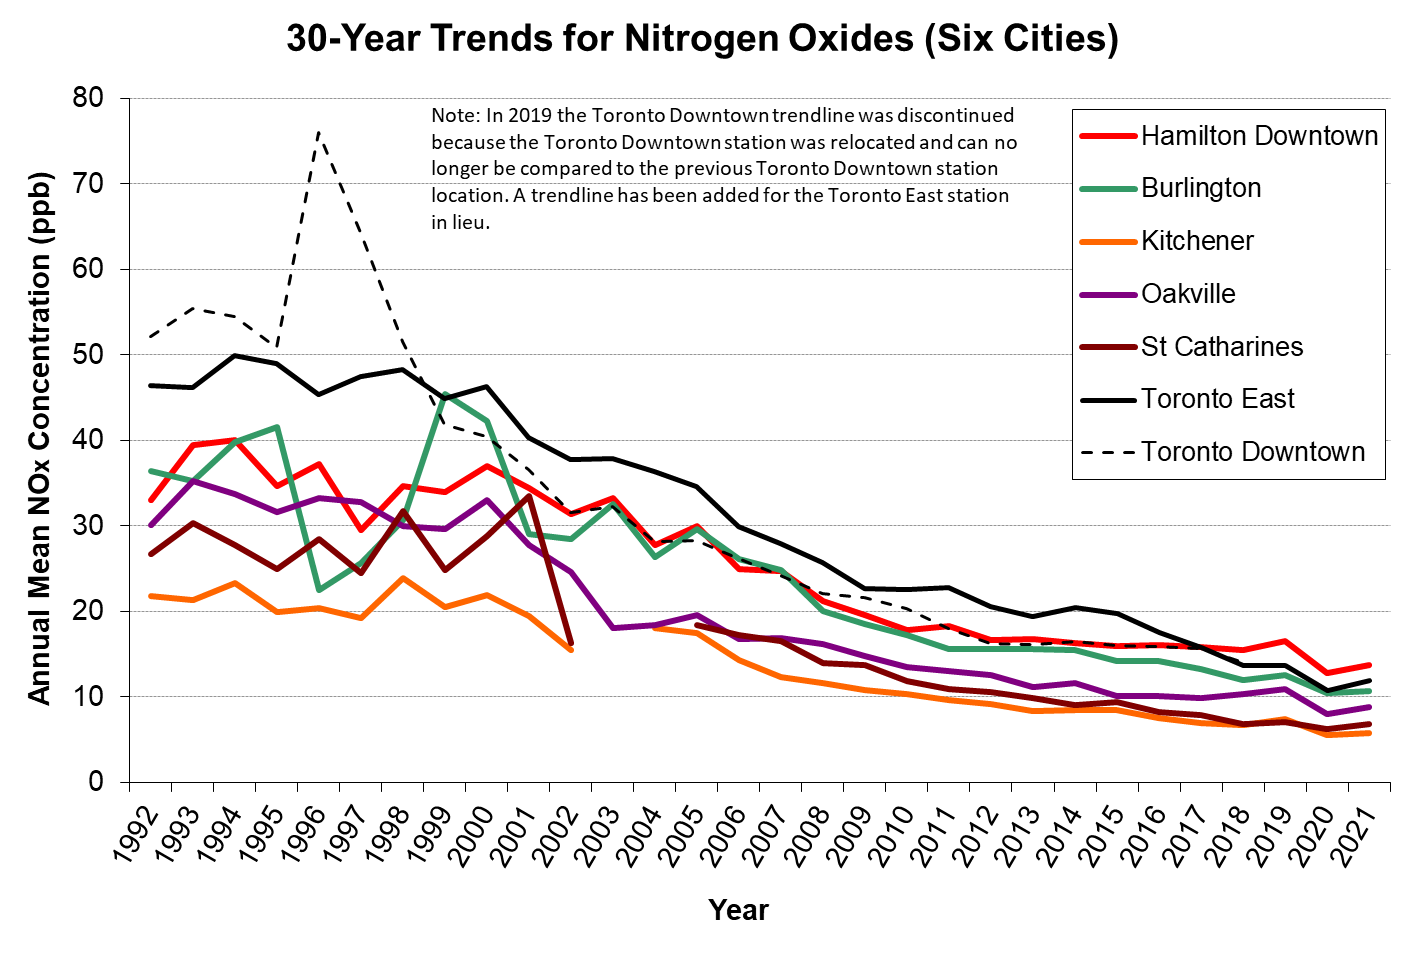
Both NO and NO2 are routinely measured and their sum is reported as Nitrogen Oxides (NOx) to reflect the presence of both species in urban areas. Ultimately all of the NO is converted to NO2 which reacts with water in the atmosphere to produce nitric and nitrous acids (HNO3 and HNO2, respectively); these acids are converted into nitrate salts that constitute about 25% of the mass of fine particulate matter or PM2.5.
When we compare the 25-year trends in air levels of NOx in Hamilton to NOx levels in other Ontario cities, we note that all cities have seen a steadily decreasing trend over the past decade. Toronto, which has no significant industrial NOx contributors but significant vehicular NOx emissions, has shown the largest decrease. Since the 1990’s both Toronto and London have seen reductions in NOx levels of approximately 60%. Hamilton’s NOx levels have decreased by approximately 46% since 1990. The NOx levels in Hamilton have decreased more slowly than in cities such as London and Toronto during this period, due presumably to contributions from sources other than vehicles. The NOx level is the sum of the levels of NO and NO2. The decrease in the average NOx levels is a reflection of improvements in emissions performance of the vehicle fleet in Ontario over the past decade.
When viewing the figure below, please note that some data points contain values based on a partial year. This data may not be as representative of annual NOx levels. Please view this figure as an approximate representation of NOx data from these cities.
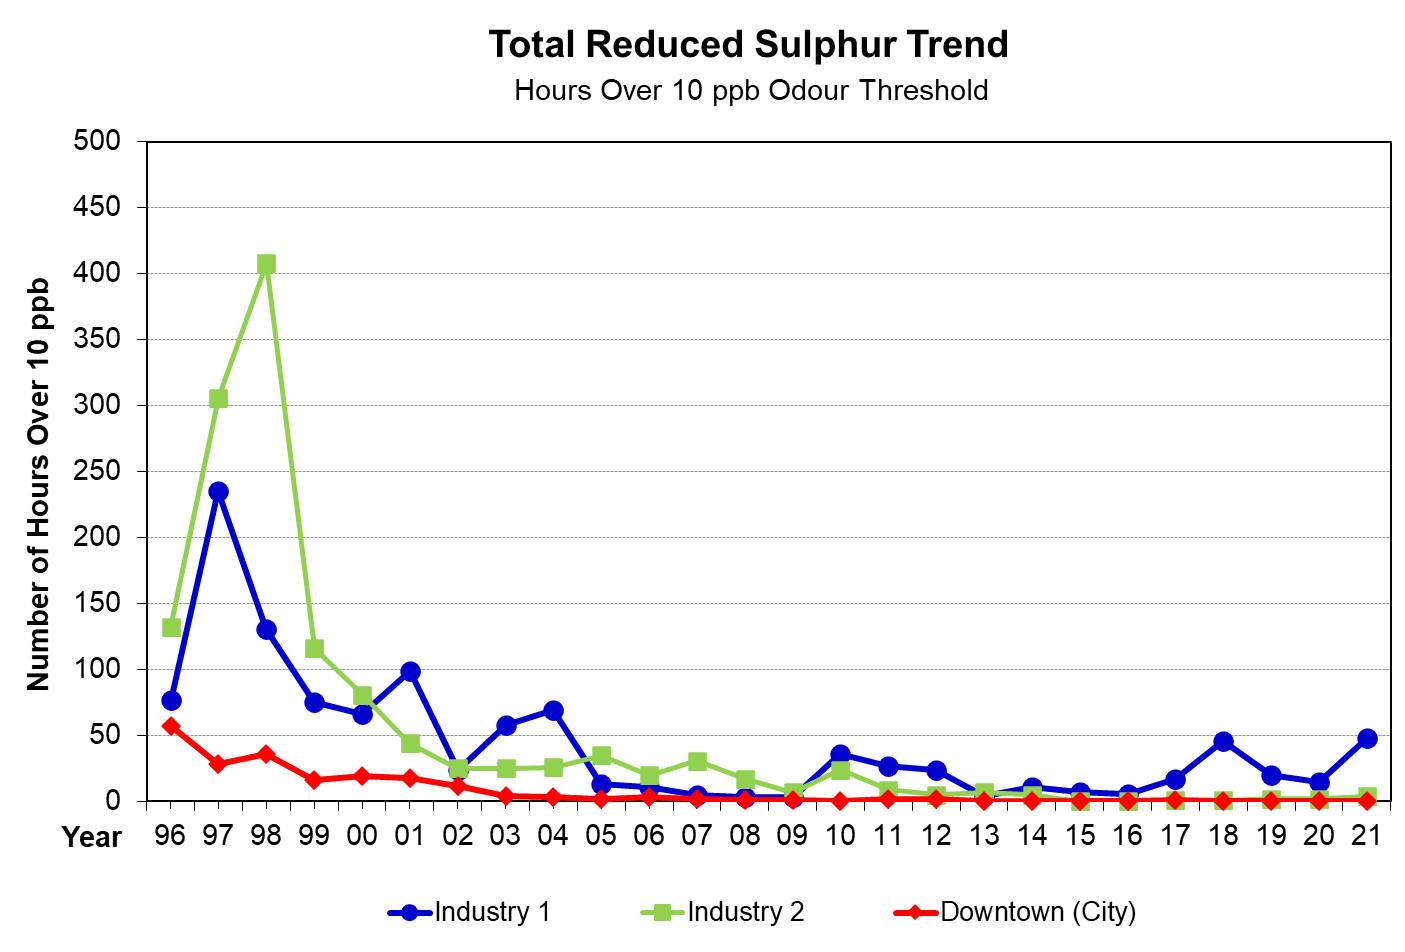
Total Reduced Sulphur
Total Reduced Sulphur (TRS) is a measure of the volatile, sulphur-containing compounds that are the basis of many of the odour complaints related to steel mill operations. An odour threshold has been set at 10 parts per billion (ppb) TRS because at this level about one-half of any group of people can detect an odour similar to the smell of rotten eggs.
The number of hours per year in which measurements exceed 10 ppb have been reduced by over 90% since the mid-1990s. This is due to significant changes in the management and operation of the coke ovens, blast furnaces and slag quenching operations associated with steel mill operations.
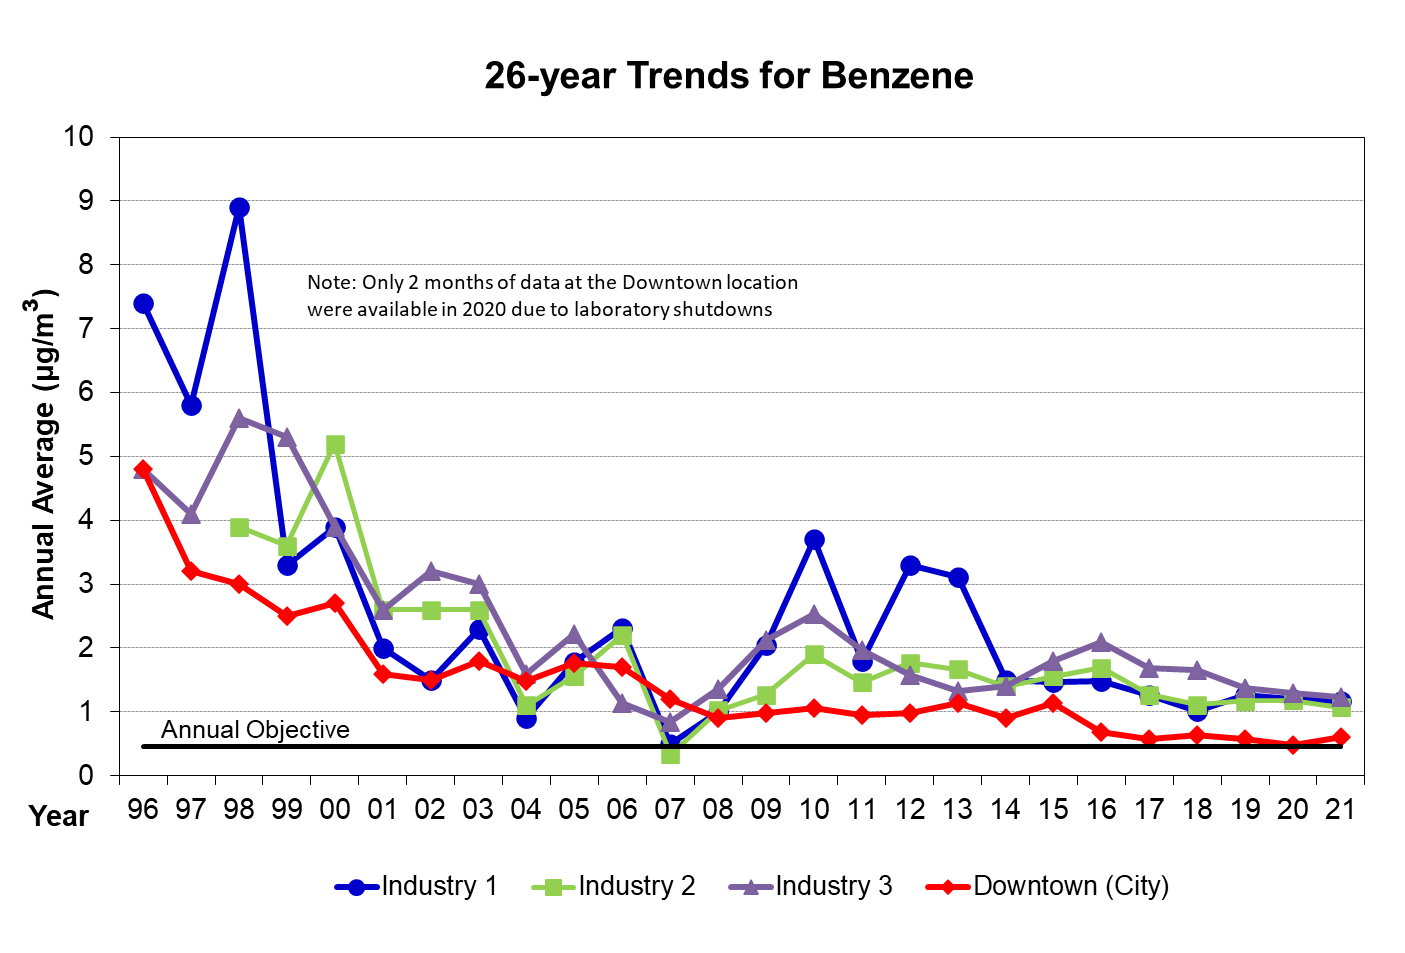
Benzene
Benzene is a carcinogenic (cancer causing agent) volatile organic compound (VOC) that is emitted from some operations within the steel industry, specifically coke ovens and coke oven by-product plant operations. Benzene is also a significant component of gasoline which can be up to 5% benzene. Vapours containing benzene are released during pumping at gasoline stations.
Air levels of benzene have been reduced dramatically since 1990s, due to significant upgrading of the coking plant operations, improved operating procedures and improved control of release of benzene vapours from the coke by-products. More work remains to be done to reduce low concentration exposures of benzene. Benzene concentrations for downtown for 2016 are currently not available.
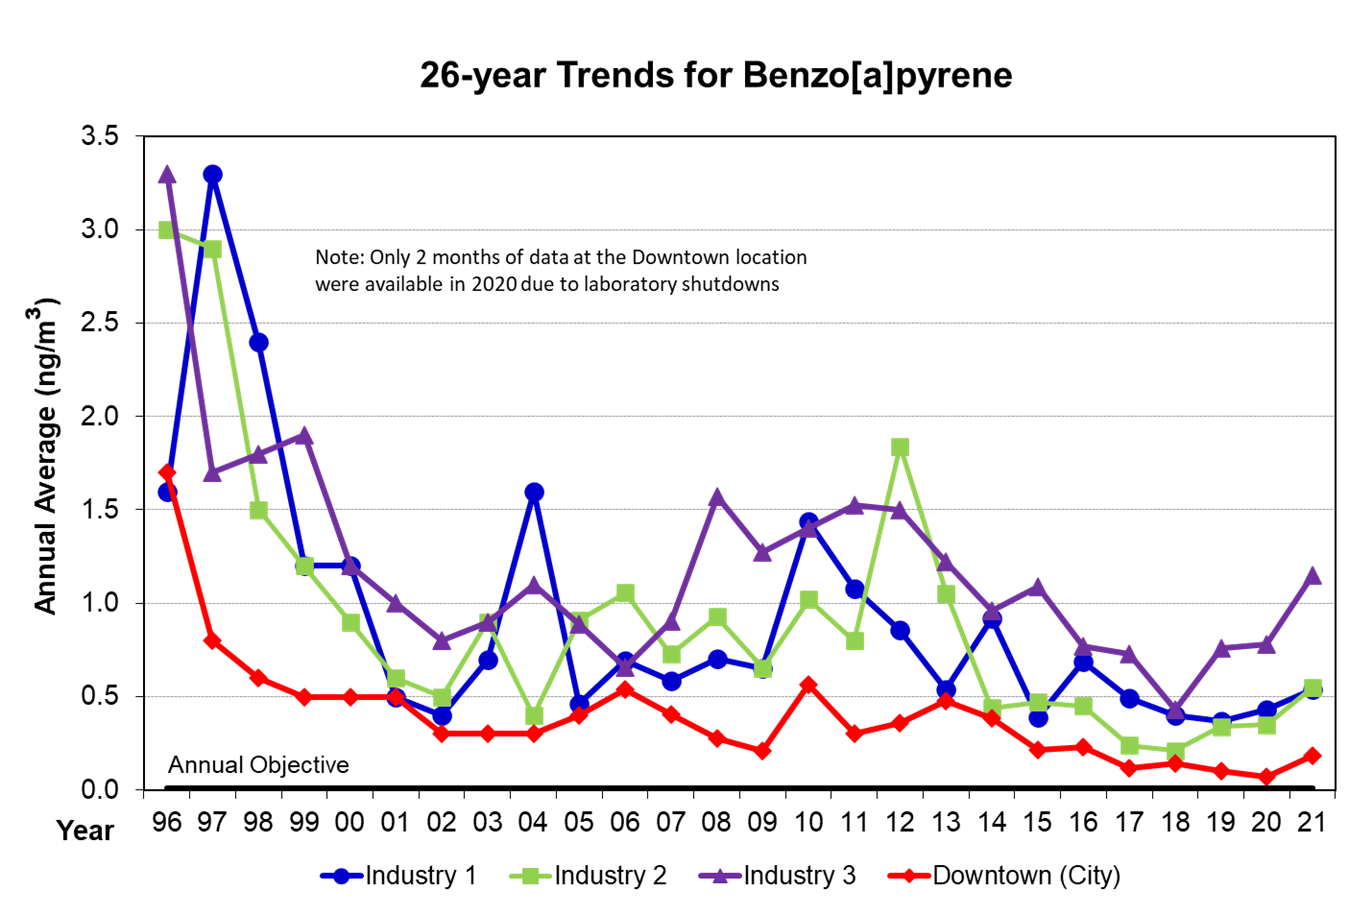
Benzo[a]pyrene
Benzo[a]pyrene (BaP) is a pollutant capable of causing cancer in animals and humans. BaP is one member of a large class of chemical compounds called polycyclic aromatic hydrocarbons (PAH). PAH are emitted when carbon-based fuels such as coke, oil, wood, coal and diesel fuel are burned. The principal sources of BaP in Hamilton are releases from coke oven operations within the steel industry. The significant decreases in ambient BaP levels since the late 1990s are the result of improvements to the infrastructure of coke ovens themselves and increased attention to the operation and maintenance procedures for proper operation of the coke ovens.
While BaP is only one of many PAH released from coking operations, BaP is the most potent single PAH in the air and the most thoroughly studied of all PAH carcinogens (cancer-causing agents) in the scientific literature. As a result of the extensive amount of chemical analysis, toxicological research and occupational exposure research done with this compound, BaP has become the primary PAH carcinogen by which exposures to many PAH-containing mixtures, such as vehicular emissions, coke oven emissions, barbecued foods, coal tar exposures, etc. are measured.
More work remains to be done to continue to improve ambient air quality and reduce industrial emissions. The new provincial standard established by the MOE- under O. Reg. 419/05 – Local Air Quality for benzo(a)pyrene of 0.01 ng/m3 comes into force on July 1, 2016. Reducing benzo (a) pyrene concentrations is a priority for the Ministry. The MECP continues to work closely with industries across the province and locally to reduce benzo(a)pyrene concentrations in ambient air.